Phase 2 Accomplishments
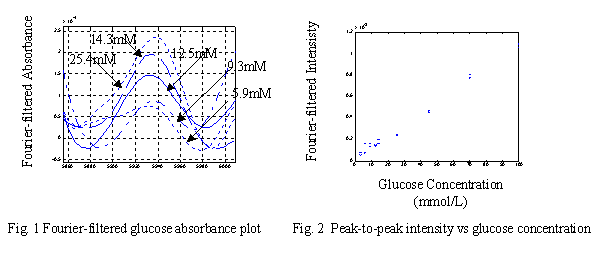
In this project sensitivity analysis of glucose in aqueous solutions was performed. The concentration levels studied spanned between 3.3mmol/L and 100mmol/L. In the first-overtone region (5500-6500cm-1), glucose absorption at ~5930cm-1 has been found to be the most useful. The first-overtone region was selected because of the relatively lower water absorption compared to the longer wavelength region, such as the combination band region (4200-4800cm-1). This would permit the radiation to penetrate deeper into the tissue and the blood vessels. However, glucose absorption in the combination band region is still a possible alternative and is worth further investigations due to its stronger glucose absorption intensities. Due to the weak and broad glucose absorption spectral features in the near-infrared region, the real absorbance spectra are usually masked by spectral baseline variations. To minimize the effects of low-resolution baseline variations and higher resolution noise, digital Fourier-filtering was applied to the absorbance spectra. Figure 1 shows the absorbance plots for clinically relevant glucose concentrations in 10-mm path-length aqueous solutions, after the application of a Gaussian-shaped digital filter. We then attempted to analyze the absorption intensity as a function of concentration. The intensity was taken to be the peak-to-peak height of the Fourier-filtered spectrum. Figure 2 shows the results, which implies a linear relationship, with a gradient of 1.1´10-5 per mmol/L. Careful analysis indicated that the real absorbance intensity was twice the filtered absorbance value. Hence, for every 1mmol/L change in glucose concentration, there is a 2.2´10-5 change in absorbance. To complete the sensitivity analysis, spectral noise over the relevant wavelength range had to be measured. The root-mean-square noise value was measured to be ~3.3´10-5 for the 10-mm path-length solutions between 5850cm-1 and 6000cm-1 wavenumbers. Therefore, this gives a signal-to-noise ratio of 0.67 for each 1mmol/L change in glucose concentration.
