Reprints
PubMed
CAVEAT LECTOR


![]()

OPTICAL SPECTROSCOPY OF BREAST BIOPSIES AND HUMAN BREAST CANCER XENOGRAFTS IN NUDE MICE
General Electric Corporate Research and Development, One Research Circle, Niskayuna, NY 12309
Received 11/25/97 Accepted 12/5/97
4. RESULTS AND DISCUSSION
4.1. In vitro Studies
As stated in Section 3.1, pathology was performed on tissue sections within 2 mm of the tissue volume probed by optical spectroscopy in order to double check the pathology of the sample under study. Any miscoded samples, or samples that either did not conform to preparation and handling protocols or were demonstrated via pathology to be subjected to substandard handling were discarded. Further, only those malignant samples demonstrated by pathology to have little or no other tissue types present were included.
The transmittance spectrum through a typical tissue specimen is composed of absorption resonances superimposed on a smoothly varying background caused by light scattering. For the narrow scans, each spectrum was manipulated as shown in figure 1. Transmittance (T) data were converted to absorbance A, where A = - ln (T), and the scattering background was removed by first fitting and then subtracting a fifth order polynomial from the absorbance data. Finally, using a combination of Gaussians and Lorentizians, the best least squares fit of the sum of these peaks to the background corrected experimental data was obtained. The approach taken was to use the least number of peaks that would adequately fit the data and still yield a reasonable physical solution, i.e a peak was deemed real if its existence was obvious by inspection or, if it corresponded to the absorption of a biological chromophore known to be present in the sample.
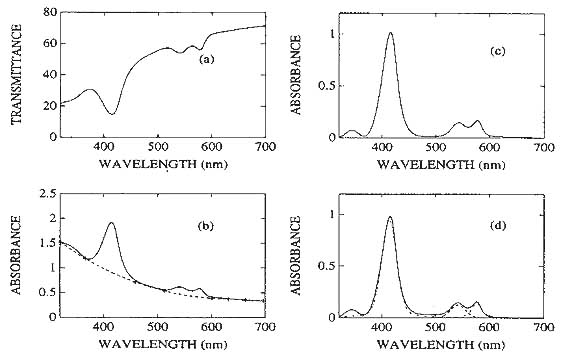
Figure 1. Data manipulation. (a) Transmittance spectrum as collected. (b) Converted to absorbance [A = -ln(T)]. (c) Light scattering background (----) subtracted to yield 'pure' optical absorbance spectrum. (d) Deconvolution of absorbance spectrum yields four absorption resonances.
4.1.1 Breast Biopsies
The dominant features in the spectra of the biopsies are water absorption peaks, absorption peaks attributable to fat, and hemoglobin absorption peaks. It was quickly established (figure 2) that adipose and fibroglandular tissue are very easily distinguished by optical absorption spectroscopy. The 3 mm thick adipose tissue sample in figure 2 absorbs at 920, 1036, 1203 and 1724 nm, while the 500 micron thick fibroglandular sample exhibits water peaks at 965, 1177, 1441 and 1945 nm. The shape of the background in each spectrum carries a clue about light scattering in the sample especially below 1000 nm. It is interesting to note that for adipose tissue, even a sample six times as thick as a fibroglandular specimen does not scatter light as strongly as fibroglandular tissue. So, not only are light absorption resonances characteristic of tissue type but so is light scattering within the sample.
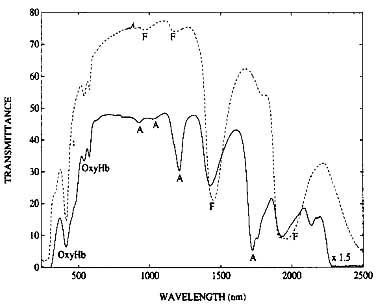
Figure 2. Optical Transmittance through 3 mm of adipose breast biopsy and 500 microns of fibroglandular breast biopsy (----). The absorption peaks marked F and A are due to fibroglandular and adipose tissue respectively. The absorption resonances marked ‘OxyHb’ are hemoglobin resonances in the tissue.
There is a transmission window from 600 nm to 1000 nm where the highest percentage of light is transmitted through biological tissue. Contributors in the field have typically looked only in this region for spectral features which can discriminate normal from malignant tissue. Unfortunately, within the sensitivity limits of the spectrophotometer, there are no easily observable chromophores (distinct from hemoglobin) that absorb in this wavelength region that can be used as a cancer marker. The region above 950 nm is dominated by broad water absorption peaks, and the region below 600 nm is dominated by the hemoglobin absorption resonances. If there are any spectral features above 1000 nm that are different for different breast tissue types, they will be masked by the water absorption peaks. However, there are differences that are observed below 600 nm that separate cancer from normal tissue. These are differences in the oxygenation saturation state of hemoglobin within the tissue.
The absorption spectra in figure 3 compare the spectral responses of breast cancer with 'normal' breast tissue and certain benign conditions. Essentially, breast cancer exhibits a deoxygenated hemoglobin (Hb) signature while normal tissue exhibits an oxygenated hemoglobin (HbO2) signature. The Soret band of 100% oxygen saturated hemoglobin appears at 415 nm and the characteristic alpha and beta bands appear at 577 nm and 542 nm respectively (19). The spectrum of pure deoxygenated hemoglobin is completely different; the Soret band is red shifted to 431 nm and the region of the alpha and beta bands is replaced by a single broad resonance at 555 nm. There is also a much weaker, but characteristic absorption peak at 760 nm.
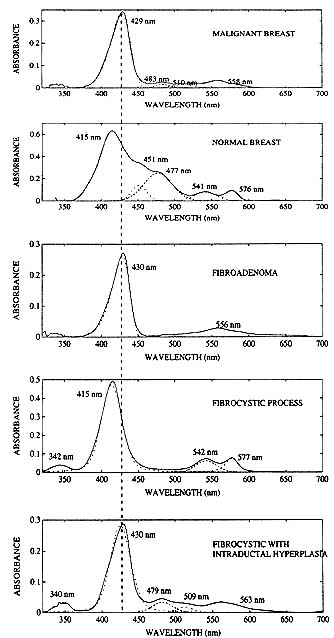
Figure 3. Absorbance spectra of malignant and benign breast biopsies. Malignancies exhibit a deoxyhemoglobin spectral signature, while normal tissue and fibrocystic disease, a benign breast tumor sometimes coded as malignant on x-ray mammograms, both exhibit an oxyhemoglobin spectral signature. Fibroadenoma, a mammography and MRI false positive, exhibits a deoxyhemoglobin spectral signature similar to the malignant breast. In fibrocystic disease with intraductal hyperplasia, the spectral response is mixed, but the deoxyhemoglobin optical signature dominates the spectrum.
Component fitting was used to determine peak positions and peak widths of the tissue absorption resonances by assuming a combination of Gaussians and Lorentzians for the peak shape. The hemoglobin Soret band is clearly asymmetric, but no attempt was made to include an asymmetry factor or to derive any information from variations, if any, in such a parameter. An unidentified peak at 512 nm was observed in the biopsy cancer samples that did not appear in the normal or benign tumor specimens. Though this resonance at first glance appears to be an additional means of cancer discrimination by optical spectroscopy, it is extremely weak and probably has limited utility pending its identification. The results of component fitting also reveal in some of the samples, traces of bilirubin, which absorbs in the blue at about 452 nm, and a transition at about 480 nm tentatively assigned to fat absorption.
Figure 3 shows that the spectral signature of fibroadenoma, a mammography false positive, is very similar to that for cancer except for the 512 nm peak. On the other hand, optical spectroscopy can clearly distinguish fibrocystic disease, another mammographic false positive, and in fact does indicate through variations in spectral shape and peak position, the presence of intraductal hyperplasia. These In vitro findings strongly suggest that optical spectroscopy, which measures spatially averaged tissue function, may be useful in non invasive tissue diagnostics.
The fact that malignant tumors differ from normal tissue and benign tumors in the oxygenation state of hemoglobin, could be due in part to the differences in blood flow rates and therefore oxygen consumption rates (20) of the various tissue types. Studies on the nature of tumor hypoxia have been going on for decades (21), usually in connection with efficacy of radiation treatment.
4.1.2. Human Breast Cancer Xenografts
Three human breast cancer cell lines were implanted into nude mice at UCLA Medical Center in California: #231, #645 and Mitchell. These model tumors were harvested and shipped in growth medium to my lab at wet ice temperatures. On inspection, it was determined that the spectra of LN2 snap frozen tumors and tumors stored in growth media were very similar, proving that the preparation and treatment of the latter was adequate. Irrespective of size, all of the twenty-five tumors studied with one exception, exhibited deoxygenated hemoglobin signatures. The last cell line, the UCLA Mitchell, was very difficult to grow in the host mouse so, only two tumors in this cell line were studied; one had a HbO2 signature. In none of the model tumors studied was the 512 nm resonance evident. In the model tumors, the cells are human breast cancer cells, but the surrounding stroma and blood vessels are provided by the mouse. Thus it is possible that the 512 nm peak is indicative of the host response which may not be accurately modeled in the mouse.
The optical response of the model tumors grown from human breast cancer cell line #231 was different from that of the other model tumors. The peak positions of the hemoglobin resonances of the #231 tumors appeared at 430 nm and 555 nm on the average, much like those of the malignant breast biopsies. One of the Mitchell tumors and all of the #645 model tumors on the other hand, exhibited resonances in the Soret region ranging from 420 nm to 425 nm, and a broad resonance in the alpha and beta region with features at 523 nm, 552 nm, 561 nm and 604 nm. When compared with the spectra from the live cancer cell cultures, it is apparent that these features can be attributed to the respiration enzyme cytochrome oxidase. Visual inspection of the tumors revealed that while the #231 tumors looked like breast biopsies with surrounding stroma and blood vessels, the Mitchell and #645 tumors looked like spheroids of cells with little or no blood vessels. Clearly then, this accounts for the spectral differences in the cell lines since with little or no blood present, cytochrome oxidase will dominate the Mitchell and #645 spectra, and for the blood perfused #231 tumors, hemoglobin will dominate the spectra. It appears that UCLA was able to grow and maintain spheroids of human breast cancer cells in nude mice with minimal support from the host. Further, since these tumors were studied as soon as received with no treatment other than having been stored in growth medium at wet ice temperatures for about 24 hours, it is believed that they were viable at the time of study, even if somewhat hypoxic.
4.1.3. Breast Cancer Cell Cultures
Approximately one gram of cancer cells (UCLA cell line #231) was incubated, pelletized and placed in a quartz cuvette. Figure 4 shows the absorption spectrum of these cells. Since there is no hemoglobin in the cells and since the phosphate buffer used for washing the cells does not have an optical signature in the visible region, the absorption resonances are from the cancer cells alone. The peaks displayed are from the terminal respiration enzyme cytochrome oxidase. Though the Soret peak of cytochrome oxidase is normally masked in the model tumors and biopsy samples by strong hemoglobin absorption, it may be sufficiently strong to change the symmetry of the hemoglobin Soret of the breast tissue samples. No attempt was made to fit the asymmetry of the Soret band of the breast biopsies by trying to compensate for the presence of cytochrome oxidase absorption resonance.
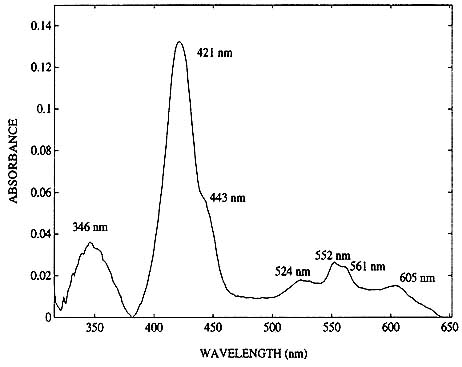
Figure 4. Absorption spectra of approximately 0.5 gm of viable cancer cells.
4.2 In vivo Studies
The tumors that were implanted intramuscularly on the hind leg were difficult to assess. In some cases, the tumors were buried within the muscle; in other cases, part of the white lesion could be visually located at the surface of the muscle. Although optical measurements were taken of both the intramuscular and subcutaneous tumors, no attempt was made to draw conclusions from the former case.
The tumors implanted subcutaneously on the back were fed by blood vessels in the skin. They tended to be encapsulated within a translucent film and were surrounded by a sheath of blood vessels; a single main vessel feeding the tumor was usually clearly evident especially in the larger (>0.5 cm) tumors. These cancers did not invade the back tissue, however, depending on the physical distribution of the cells at transplantation, some tumors extended down the length of the back and some remained localized at the implantation site. The skin over the model tumors implanted on the back varied in thickness from <250 microns to 1mm depending in part on the size of tumors. The skin over the tumor was necrotic in some areas for some of the lesions. Whenever this occurred, an incision was made in the skin at the base of the tumor and (since in most cases, the skin adhered to the tumor), both skin and tumor were raised to allow measurements to be taken on the underside of the tumor. The procedure was performed in such a way as to minimize bleeding. Care was taken to prevent any blood from the incision in the skin from contaminating the area of the tumor selected for measurement, and, prior to measurement, the sheath of blood vessels surrounding the tumor was carefully pushed aside.
We will confine ourselves to a discussion of the optical response of exposed subcutaneous tumors. The decision to remove a flap of skin to uncover the tumors was made with two objectives in mind: (i) to exclude the contribution from the skin for ease of data interpretation and (ii) to remove the risk of being limited by the penetration depth of light within tissue. The geometry of the 7:7 fiber optic probe used restricts the penetration depth of the light to about 8mm. However, since we are monitoring the reflected light, our actual probe volume is much smaller. This probe depth was estimated using the following simple experiment. In vitro samples of model tumors (previously harvested and stored in dry ice) were placed between two quartz slides with spacers. A wavelength reflectance filter was placed behind the model tumor specimens, and the 7:7 reflectance bundle probe illuminated the slab of tumor from the front. The probe, the slab of model tumor and the filter were placed in direct contact with each other and the response of the signal from the filter (at its specific stop-band wavelength) to increasing sample thicknesses was monitored. The thickness at which the signal from the filter almost disappeared was recorded as the depth in tissue from which useful information was received at that specific wavelength for the reflectance probe geometry used. The probing depths were recorded for three wavelengths: 420 nm (Soret region), 540 nm (in the region of the alpha and beta hemoglobin bands) and 750nm which is close to the deoxyhemoglobin resonance at 760 nm. The approximate depths were 0.5, 1.5 and 2mm respectively.
Typical reflectance spectra from an exposed back tumor are shown in figure 5. The reflectance units are not absolute. Several diffuse standards were tested in the field, but since none were effective as a reflectance standard with the geometrical configuration used, a mirror was used as reference. For this reason, the reflectance of the tissue as recorded, not surprisingly, is less than one percent. This less than optimum choice of reflectance standard does not affect our results, since we are not attempting quantitation, but rather simply the qualitative identification of the oxidation state of hemoglobin in the tissue.
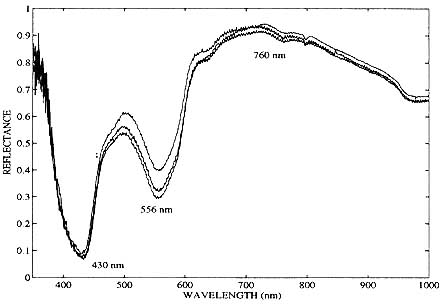
Figure 5. In vivo optical reflectance spectra of a human breast cancer xenograft (UCLA #645 cell line) 8 days after subcutaneous heterotransplantation into a nude mouse. Tumor size:7mm x 4mm x 4mm.
Three consecutive scans were recorded in figure 5, each scan lasting approximately one minute. This particular example of In vivo experimental data was taken on the eighth day after subcutaneous implantation of UCLA #645 cancer cells, when the tumor was 7mm x 4mm x 4mm in size. The tumor's optical reflectance spectrum qualitatively resembles that of completely unsaturated hemoglobin. These spectra also demonstrate the high degree of reproducibility of the optical measurements from the nude mice and confirms that the data collection protocols (e.g. mouse handling and probe pressure by operator) were adequately implemented. Another tumor grown from the same cell line is shown twenty-nine days after subcutaneous in figure 6. This large (20mm x 17mm x 10mm) tumor also exhibits a deoxyhemoglobin spectral signature. Both of the tumors in figure 5 and 6 were in direct contact with the fiber optic probe. In both cases, minimal bleeding occurred at the incision, and the probe area itself was not contaminated.
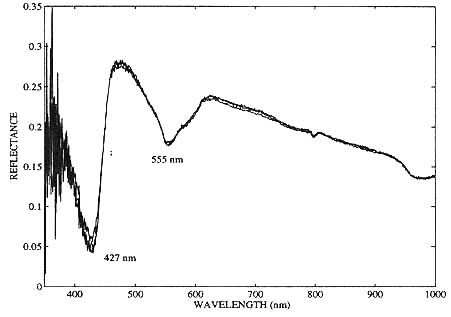
Figure 6. In vivo optical reflectance spectra of a human breast cancer xenograft (UCLA #645 cell line) 29 days after heterotransplantation into a nude mouse. Tumor size: 20mm x 17mm x 10mm.
Five mice without tumor implants were used as controls. A small flap of skin was raised over the back of the anesthetized mouse and the reflectance spectra recorded. The skin flap was sutured back into place after the measurement and the mouse allowed to recuperate. Without exception, the sites monitored exhibited an oxyhemoglobin spectrum. So, we conclude that the measurement and mouse handling protocols did not cause desaturation of hemoglobin, which effect would mimic the signals from the tumors.
The influence of applied pressure to the tumor on the reflectance spectrum from the mice was addressed by sensitizing the operator holding the mice against the probe to how much pressure could be applied without corrupting the reflectance data. A series of tests involving varying the pressure of the probe on the operator's hands and fingers and on the mice themselves indicated that it was indeed possible to distort the reflectance spectrum if too much pressure was applied to the area of interest. Conversely it demonstrated that there is a 'safe' pressure range, and that once the operator maintained that pressure for the mice studied, it was possible to collect uncorrupted data. Further, the system was demonstrated to be very sensitive to positional changes of the mouse, and to operator motion. If any of these disruptions occurred during data acquisition, it was reflected in the data and the data was discarded. It should be noted here that not even under conditions of extreme application of pressure could we generate deoxyhemoglobin signatures.
Figure 5 exemplifies a more benign form of body motion that was tolerated. The ripple present on the spectrum in the near infrared is not due to system noise, but rather to the involuntary shivering of the mouse. That the absorption features are not affected by this kind of motion was verified in a few of the mice in which shivering during data acquisition occurred. The mouse in figure 6 was not shivering during data acquisition.
The most important result of this In vivo study is that statistically, the model tumors presented significant regions of completely unsaturated hemoglobin, confirming the In vitro experimental results. Figures 5 and 6 show that this tendency to oxygen depleted hemoglobin may be found not only in large, advanced tumors but also in small, early (8 days old) tumors. The smallest tumor evaluated was a flat, round 4 mm lesion (15 days old), and this too had a deoxyhemoglobin optical signature. Another finding of import was that the tumors were in fact heterogeneous with respect to hemoglobin oxygen saturation; of the several positions on the exposed surface of the larger tumors that were monitored, most exhibited a desaturation of the hemoglobin. At some positions however, the tumor had an oxyhemoglobin signature. What this tells us is that while optical spectroscopy as implemented here presents a possible marker for lesion location, demarkation of tumor borders would not be possible.
4.3. Spectral Discrimination
An obvious way to quantify these experimental findings would be to measure the actual oxygen saturation of hemoglobin in the excised tissue and in the model tumors In vivo. In order to do this, we would need to compensate for the presence of cytochrome oxidase and other chromophores like bilirubin in the spectra. Since this was outside the scope of the studies, we elected to display the spectral differences between cancer and benign breast processes on a scatter diagram using ratios based on the oxygenation state of the hemoglobin. The scatter diagram for the In vitro samples is shown in figure 7 which plots the ratio of absorbances at 544 nm and 560 nm (an isosbestic point) against the ratio of absorbances at 577 nm and 586 nm (an isosbestic point). For clarity, only a few of the samples studied are represented on the diagram. The isosbestic points were used to normalize the data and correct for the difference in blood volumes that existed from sample to sample. In the figure, the circles represent the benign samples (which include normal and benign tumors) and, the plusses represent the malignant samples.
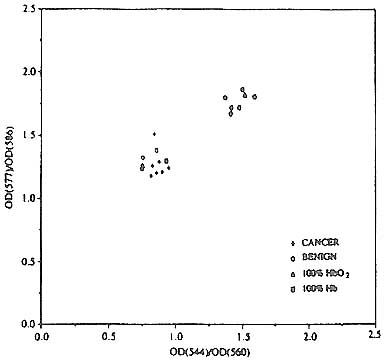
Figure 7. Scatter diagram showing the separation of malignant from benign breast processes using biopsy breast tissue. (See text.)
As a benchmark, the triangle and the square represent values which correspond to human tissue with physiological levels of hemoglobin oxygen saturation and completely desaturated blood, respectively. These values were obtained by creating laboratory models of these two types of functional conditions. First, a blood donor inhaled pure oxygen for five minutes. Then blood was drawn to capture a blood sample at physiological levels of oxygen saturation. This sample was split into two, and one part (7ml.) was deoxygenated by adding an excess of sodium dithionite (30 mg). Then, ideal tissue phantoms of normal tissue and malignant tissue (suitable for absorption spectroscopy) were created by adding a drop of the oxygenated whole blood sample to a cuvette of viable
pelletized cancer cells, and a drop of the deoxygenated whole blood sample to a second cuvette of viable pelletized cancer cells. Two oxygenated tissue phantoms and three desaturated tissue phantoms were created in this fashion. The appropriate averages of optical spectra collected from these phantoms were taken, and the absorbance ratios calculated from these averages.
A quick examination of figure 7 reveals that the benign and malignant samples separate into clusters in the vicinity of the appropriate calibration data points corresponding to the tissue phantoms. It can also be seen that three of the benign samples fall in the malignant cluster; these correspond to two fibroadenoma samples and the single case of fibrocystic disease with intraductal hyperplasia studied.
Figure 8 shows a similar cluster diagram for the In vivo results. In this case also, we find that the tumors cluster and are separate from the cluster of 'normals'. The 'normal' control samples in this case were the hands and fingers of volunteers; it is not possible to grow benign tumors in the nu/nu hemozygotes. The assumption made here is that the spectra of normal hands and fingers are similar to normal breast tissue. When compared with the In vitro results in Figure 7, it is immediately obvious that the In vivo model tumors and the volunteers are less tightly clustered and the separation between them less distinct than in the In vitro case. This is not surprising as one would expect to record far more spread in the hemoglobin oxygenation In vivo than In vitro. Nevertheless, the important result here is that the model tumors In vivo do form a cluster and they are distinct from the normal cluster. This is promising and suggests that breast cancer discrimination on the basis of functional imaging may indeed be possible.
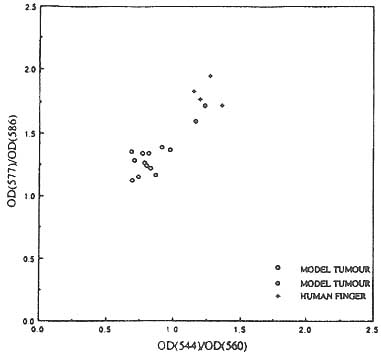
Figure 8. Scatter diagram showing the clustering of human breast tumor xenografts In vivo and the separation of the tumor cluster from that of the controls. (See text.)